
In an era defined by information overload, the ability to distill complex data into digestible visual formats is no longer a luxury—it is a necessity. Whether you are a digital marketer trying to capture attention on a scrolling feed, or an educator explaining a complicated theory, visual aids are your strongest allies.
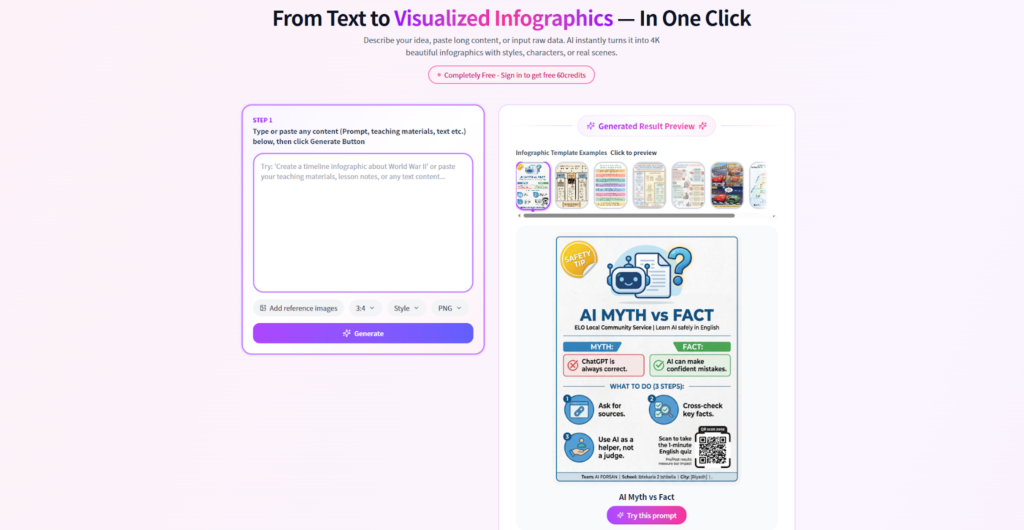
While professional design software like Adobe Illustrator remains the industry standard for high-end graphics, the steep learning curve makes it inaccessible for the average user. Enter Infograph.app — a versatile AI-powered Concept Map Maker and intuitive visual design platform that is rapidly gaining traction. Positioned as both a robust Concept Map Maker and a powerful Infographic Generator, Infograph.app promises to democratize professional-grade visual creation.
In this review, we take a comprehensive look at Infograph.app and explore how it bridges the gap between raw data and compelling visual storytelling.
The Essence of Infograph.app
At its core, Infograph.app is a web-based design solution built for non-designers who want professional results without complexity. Unlike clunky legacy software that requires installation and heavy processing power, Infograph.app operates entirely in the cloud, offering a streamlined, drag-and-drop interface accessible from any browser.
What makes Infograph.app different from traditional tools is its hybrid positioning. It is not just a whiteboard. It is not just a graphic editor. It combines the structural intelligence of a Concept Map Maker with the polished output of an advanced Infographic Generator.
Rather than limiting users to one format (social posts, presentations, reports), Infograph.app acts as a central creative hub where ideas can be brainstormed, structured, and visually refined — all in one place.
Standout Functions & Design Capabilities of Infograph.app
To understand the real value of Infograph.app, we need to look beyond templates and explore its core toolkits.
1. Intelligent Concept Map Maker
The crown jewel of Infograph.app is its advanced Concept Map Maker functionality.
Organizing ideas non-linearly is essential for planning, studying, and strategic thinking. Infograph.app provides a dedicated concept mapping workspace where users can:
- Create flexible nodes
- Link ideas with customizable connectors
- Build multi-level hierarchies
- Freely reposition elements
- Color-code thematic branches
Unlike rigid diagram tools, the Concept Map Maker inside Infograph.app allows full design freedom. You are not confined to grids. You can structure information naturally while maintaining visual clarity. This makes it ideal for:
- Business workflows
- Academic research breakdowns
- Organizational charts
- Strategic planning frameworks
With Infograph.app, your concept maps are not just logical — they are presentation-ready.
2. Built-in Infographic Generator
Beyond mind mapping, Infograph.app functions as a full-scale Infographic Generator.
Turning spreadsheets and raw data into compelling visuals can be time-consuming. Infograph.app simplifies this with built-in charts, graphs, and data visualization widgets. Simply input your data, and the Infographic Generator automatically transforms it into:
- Pie charts
- Bar graphs
- Line charts
- Statistical visuals
- Custom data modules
This makes Infograph.app a powerful storytelling tool for bloggers, marketers, educators, and analysts who want to convert numbers into narratives.
3. AI-Assisted Layout & Design Intelligence
Keeping pace with modern design trends, Infograph.app integrates AI-powered layout suggestions and smart color pairing.
Many users struggle with blank canvas syndrome. Infograph.app reduces that friction by offering:
- Automated alignment guidance
- Harmonized color palette suggestions
- Balanced layout recommendations
Even if you have zero design experience, Infograph.app ensures your output adheres to visual best practices.
4. Extensive Asset Library
A major strength of Infograph.app is its built-in design ecosystem. The platform includes a large repository of:
- Icons
- Vector illustrations
- Stock images
- Background textures
- Themed graphic elements
Whether you’re creating a biological process map or a marketing funnel infographic, Infograph.app eliminates the need to search for assets externally.
Why Users Are Switching to Infograph.app
With platforms like Canva and Miro dominating their respective spaces, why are users exploring Infograph.app?
1. Logic Meets Aesthetics
Many tools are either visually attractive but structurally weak — or logically strong but visually bland. Infograph.app bridges this gap by combining a professional Concept Map Maker with a polished Infographic Generator in one seamless workflow.
You no longer need separate software for mapping ideas and designing visuals. Infograph.app handles both.
2. Zero Learning Curve
The interface of Infograph.app is intuitive and self-explanatory. The onboarding process is minimal because the UI follows familiar drag-and-drop patterns.
If you can use basic presentation software, you can master Infograph.app within minutes.
3. Cost-Effective All-in-One Platform
Instead of subscribing to:
- A mind-mapping tool
- A stock photo platform
- A graphic design editor
You can consolidate your workflow inside Infograph.app. For freelancers, startups, and small teams, this integration significantly reduces subscription fatigue.
4. Template Diversity by Use Case
Templates in Infograph.app are categorized by:
- Education
- Business strategy
- Marketing campaigns
- Research summaries
- Project planning
This means your starting point is already aligned with your goal, making Infograph.app especially efficient for time-sensitive projects.
Who Should Use Infograph.app?
Educators & Academic Researchers
Teachers can leverage the Concept Map Maker in Infograph.app to create:
- Visual lesson plans
- Historical timelines
- Scientific process diagrams
- Knowledge maps
Visual learning increases retention, and Infograph.app makes it effortless.
Content Marketers & Bloggers
In SEO-driven content marketing, visuals increase dwell time and engagement. Using the Infographic Generator inside Infograph.app, marketers can repurpose blog posts into:
- Pinterest graphics
- LinkedIn carousel visuals
- Data-driven content summaries
This boosts both traffic and shareability.
Project Managers & Strategists
Before execution comes clarity. Business professionals use Infograph.app to visualize:
- SWOT analyses
- Workflow diagrams
- Stakeholder hierarchies
- Strategic roadmaps
The combination of structure and aesthetics makes Infograph.app pitch-deck ready.
Students
For visual learners, outlining essays and preparing for exams becomes significantly easier with the Concept Map Maker inside Infograph.app. Turning notes into structured visual maps transforms passive learning into active comprehension.
User Experience of Infograph.app
Upon logging in, Infograph.app presents a clean, minimal dashboard. The canvas maximizes screen real estate, while the toolbar remains unobtrusive.
Performance is smooth and responsive. Even when working with high-resolution images and complex concept nodes, Infograph.app maintains stable performance.
Export formats include:
- PNG
- JPG
Ensuring your work from Infograph.app is compatible across digital and print platforms.
Final Verdict: Is Infograph.app Worth It?
In a crowded design market, Infograph.app establishes a clear identity. It understands that design is not just decoration — it is communication and organization.
By combining:
- A flexible Concept Map Maker
- A powerful Infographic Generator
- AI-assisted design intelligence
- A rich asset ecosystem
Infograph.app delivers a unified solution for visual thinking.
If you are tired of switching between mind-mapping tools and graphic design apps, Infograph.app offers a streamlined, all-in-one environment to transform abstract ideas into structured, compelling visuals.
For professionals, educators, marketers, and students alike, Infograph.app is not just another design tool — it is a smarter way to think visually.